
How to Track Your Betting Results the Right Way

If you bet regularly, there is a big difference between remembering a few good wins and knowing how well you have actually performed over the past three, six or twelve months.
Without a proper record, it is easy to believe that a certain type of bet is working simply because the wins stick in your memory more than the losses.
The best way to track your sports betting results is straightforward: record every bet in the same place, including the odds, stake, market and final result. Then look beyond how many bets you won and focus on how much you actually made or lost compared with the total amount you staked.
Why should you track every bet?
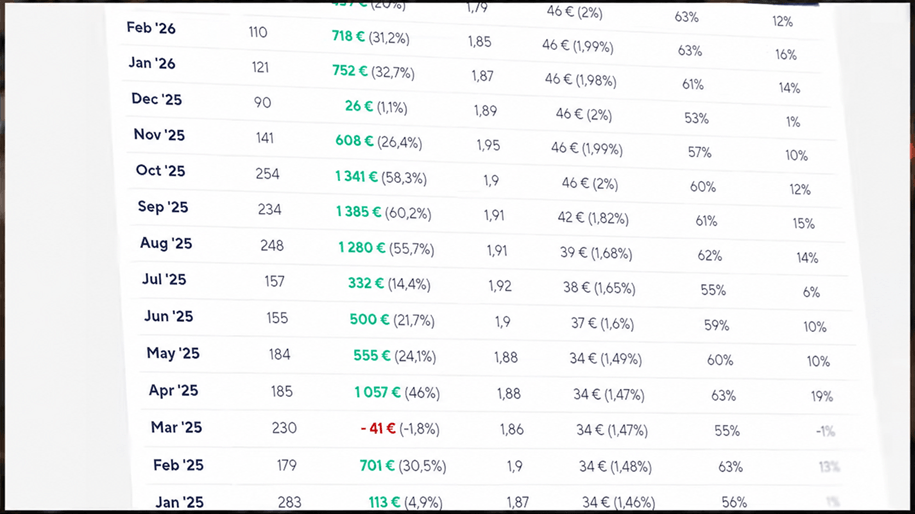
A good betting tracker is more than a list of winning and losing selections. Once you have enough data, it can show you:
- whether you are actually making or losing money;
- which sports and leagues produce your best results;
- which betting markets perform well for you;
- whether your staking is consistent;
- where your biggest losses are coming from.
Your bookmaker account history can provide some of this information, but it becomes much less useful if you bet with several operators. Keeping everything in one sports betting tracker gives you a clearer overall picture.
This idea is also supported by recent research from the UK Gambling Commission. In research published in September 2026, participants wanted clearer information about their true net spend and access to periodic performance data. Sports bettors in particular valued information such as net spend and win/loss ratios, while some participants already used monthly profit and loss statements to understand their gambling activity.
In other words, looking at the bigger picture matters much more than remembering your last few results.
What should a sports betting tracker include?
You do not need a spreadsheet with 30 different columns. The goal is to record enough information to answer useful questions later.
| Data | Why track it? |
|---|---|
| Date | Helps compare different periods |
| Sport / League | Shows where your strongest and weakest results come from |
| Event | Identifies the match or event |
| Market | 1X2, totals, handicaps, player markets, etc. |
| Selection | Records exactly what you backed |
| Odds | Essential for analysing performance properly |
| Stake | Shows how much money was risked |
| Bookmaker | Useful if you use several operators |
| Result | Win, loss, push or void |
| Profit / Loss | Shows the actual financial result |
| Closing odds | Optional, but useful for CLV analysis |
| Notes | Records your reasoning or important context |
The notes column is easy to overlook, but it can become very useful.
If you go through a poor run later, your numbers might tell you where the losses came from. Your notes can sometimes help explain why. Perhaps you started backing markets you normally avoid, increased your stakes after losses or placed bets without doing your usual analysis.
Which numbers actually matter?

Profit and loss
This should always be clear.
If you stake £100 at decimal odds of 2.00 and the bet wins, £200 is returned to you. Your profit is £100, not £200. The total return includes your original stake.
A betting profit tracker should therefore record the actual profit or loss from every wager rather than simply the amount returned by the bookmaker.
Return compared with the amount staked
You will often see this described as ROI – Return on Investment. The name sounds more complicated than the calculation actually is. It simply answers:
How much have I made or lost compared with everything I have staked?
The calculation is: ROI = Net profit ÷ Total amount staked × 100
Imagine you stake a total of £2,000 over a month and finish with £100 profit. Your return on the money staked is 5%. This gives the profit some context. Making £100 after staking £500 is very different from making the same £100 after staking £10,000.
Units won or lost
A unit is simply a standard betting amount.
If your normal stake is £20, you might define £20 as 1 unit. Finishing a period at +8 units would therefore represent £160 profit at that stake size.
Tracking results in units makes it easier to compare different periods or even different bettors without focusing on the exact amount of money involved.
For the numbers to remain useful, however, the value of one unit should not constantly change.
Why can your win rate be misleading?
Consider two simplified examples:
| Win rate | Average odds | Possible outcome | |
|---|---|---|---|
| Bettor A | 60% | 1.50 | Could still lose money |
| Bettor B | 45% | 2.50 | Could still be profitable |
The reason is simple: your odds matter.
Winning 60% of your bets sounds impressive, but it tells us very little without knowing the prices you backed and how much you staked. It is exactly this distinction that forms the basis of the value betting approach.
That is why a record such as “58% winning picks” should never be viewed on its own. Your actual profit or loss and your return compared with the total amount staked provide far more context.
Excel, Google Sheets or a dedicated betting tracker?
There is no single correct choice.
| Excel / Google Sheets | Sports betting tracker |
|---|---|
| Free or inexpensive | Usually quicker to maintain |
| Fully customisable | Automatic calculations |
| Easy to add your own categories | Ready-made filters and charts |
| More manual work | Some data may be imported automatically |
| You create the formulas | Often calculates profit, units and other metrics for you |
If you place a relatively small number of bets, a well-organised spreadsheet may be all you need.
A dedicated sports betting tracker becomes more useful when the volume increases and you want faster filtering, automatic calculations or detailed breakdowns.
The important part is not which tool you choose. It is whether every bet goes into the same system. The most advanced betting profit tracker in the world will not give you an accurate picture if you conveniently forget to add losing bets.
Break down your results to see what actually works

Your overall result is only the starting point.
Once you have collected enough data, try filtering it by:
- sport;
- competition;
- betting market;
- odds range;
- pre-match vs live betting;
- singles vs accumulators;
- month or season;
- bookmaker.
Imagine your overall result shows a return of +2%. That sounds useful, but it hides what is happening underneath.
For example, your overall result might be +2%, but you could be at +8% for goals in the Premier League and -10% for cards. If you want to understand the reason behind such a discrepancy, take a look at our football statistics for the relevant league. If you only look at the final figure, this discrepancy remains hidden. Suddenly, the data becomes much more useful.
The purpose of tracking is not to create impressive statistics. It is to identify patterns, including the ones that show where your betting is underperforming.
Be careful with very small samples, though. Five winning bets in one competition do not automatically prove that you have found an advantage. The more observations you have, the more useful these comparisons become.
Common betting tracking mistakes

A tracker is only as reliable as the information you put into it. Some common mistakes include:
- recording some bets but forgetting others;
- remembering wins while leaving losses out;
- confusing total returns with actual profit;
- looking only at win rate;
- constantly changing the size of one unit;
- failing to record void bets or cash-outs;
- drawing major conclusions after only 10 or 20 bets;
- treating deposits and withdrawals as betting profit or losses;
- collecting data but never reviewing it.
Consistency matters more than creating an overly complicated system. A simple spreadsheet that contains every wager will usually tell you more than an advanced tracker containing only half of them.
What is the best way to track your sports betting results?
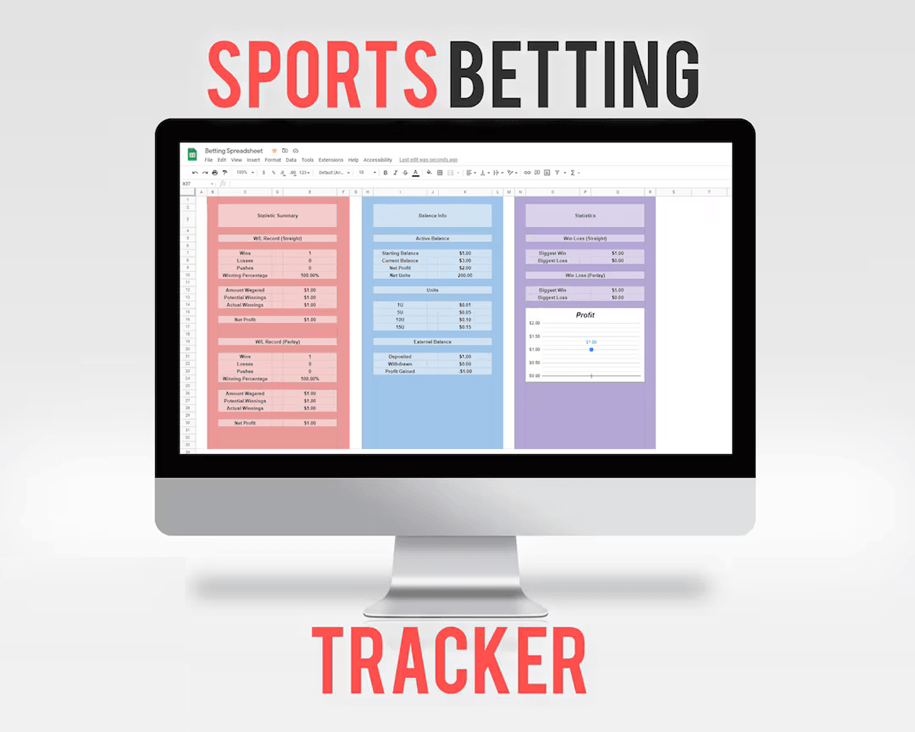
The best way to track your sports betting results is to record every wager in the same betting tracker, including the date, sport, market, odds, stake, result and actual profit or loss.
Then review the data regularly instead of looking only at your latest bets. Compare your total profit or loss, your return relative to the amount staked and your performance across different sports, leagues and betting markets.
There is no single statistic that tells the whole story. The clearest picture comes from combining several simple numbers and reviewing them over a meaningful number of bets.
If you’re still building your own betting history, you could start with our football predictions for today.
If we missed something, add it in the comments