
How to Use Historical Data Before Starting a Betting Strategy

A big winning bet will always get more attention than a spreadsheet full of numbers. But one winning slip tells you almost nothing about whether a betting strategy actually works. What matters is whether the same decisions can produce an edge over dozens or hundreds of bets.
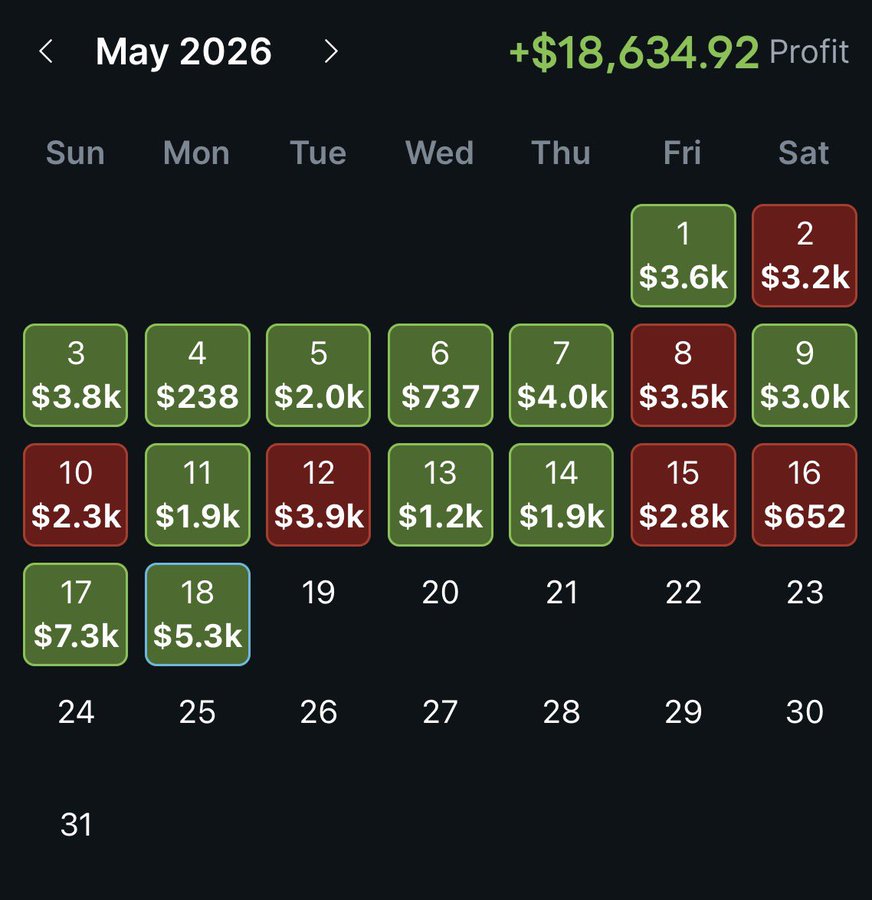
When you record your results consistently, this sort of visualisation gives you a quick overview of your winning and losing periods and helps you spot recurring patterns more easily.
This is where sports betting data becomes useful. Results, odds and market movements can help you test whether an idea has worked before and whether the same edge could exist again.
The important word here is test. Historical data should challenge an idea, not convince you that a strategy works because you found an attractive pattern in past results.
What Type of Betting Strategy Are You Actually Testing?
Before digging through stats, you need to know what kind of strategy you are trying to build, because past data plays a different role depending on the approach.
| Strategy | Where does the edge come from? | Role of historical data |
|---|---|---|
| Matched betting | Promotions, bonuses and free bets | Limited |
| Arbitrage betting | Odds differences between bookmakers | Useful for tracking opportunities |
| Value betting | Odds that appear higher than the true probability | Essential for checking whether you have an edge |
Matched betting and arbitrage depend on specific offers or price gaps that can disappear quickly. Value betting works differently because it is based on price.
If your analysis suggests an outcome has a 50% chance of happening, the fair odds would be 2.00. You can quickly check similar relationships between probability and price with our odds calculator. If the bookmaker is offering 2.30, there may be value – but only if your probability estimate is actually more accurate than the market’s. If you want to understand the relationship between probability and price in more detail first, take a look at how betting odds work.
And that is exactly why statistics matter so much. The question is no longer simply: “Will this bet win?”
The question is: “Is this price wrong?” And this is where the difference between a simple bet and a well-thought-out betting strategy really begins.
Use Sports Betting Data to Test an Idea, Not Create One
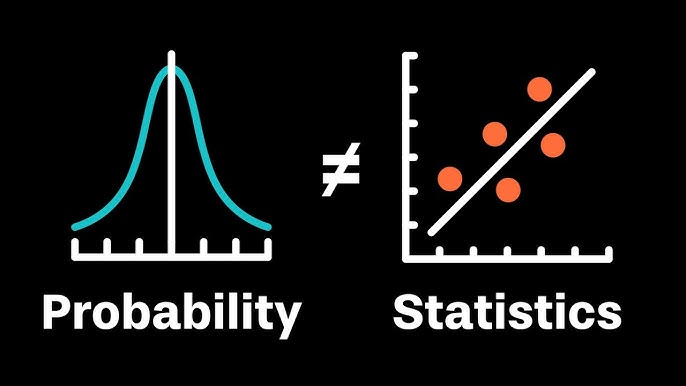
If you search through enough football statistics, you will eventually find a pattern that looks profitable. Home favourites may have won 72% of matches in one league, Over 2.5 Goals may have landed unusually often, or certain underdogs may appear to perform better after two defeats.
Those numbers can all be correct and still tell you very little about whether you have found a good strategy.
A better approach is to start with a logical idea and then use statistical data to test it. You might believe the market overreacts when a strong team loses several matches in a row, or that a player’s props line has not fully adjusted after a change in role.
Then test that idea against previous examples, keeping the original odds rather than looking only at the results. Ideally, test it on data you did not use to create the idea. A system that looks perfect only after you have adjusted the rules to fit the past is usually a warning sign, not an edge.
Start With Value, Not Win Rate

A 70% strike rate sounds far more impressive than 45%, but without the prices it tells you almost nothing.
- Strategy A wins 70% of its bets at average odds of 1.30.
- Strategy B wins 45% at average odds of 2.50.
The first strategy wins more often, yet it can still lose money if the price is consistently too short. The second can be profitable despite losing more bets than it wins.
This is the difference between predictions and value. Data for sports betting prediction can estimate how likely an event is, but the betting decision must also consider the price.
Odds Movement Tells You What Results Cannot

The final score is only one outcome. The movement of the price before kick-off can tell you how the wider market assessed the same bet.
Suppose you repeatedly take 2.10 on selections that later close around 1.90. That does not guarantee profit, but it is more informative than a short run of wins and losses because the market eventually moved towards the price you took earlier.
The reverse deserves attention too. If you regularly take 1.80 and the same selection drifts to 2.05, recent profits may be hiding a problem with your probability estimates.
Track the opening price, your entry price and the closing price. Over time, this gives you another way to judge your decisions.
How to Use Data in Major Leagues
The biggest competitions offer excellent data coverage, but that does not make them the easiest places to find an edge. Research on European football has repeatedly found that bookmaker odds are strong forecasts, although efficiency varies between leagues, bookmakers and markets.
Why Main Markets Are So Efficient
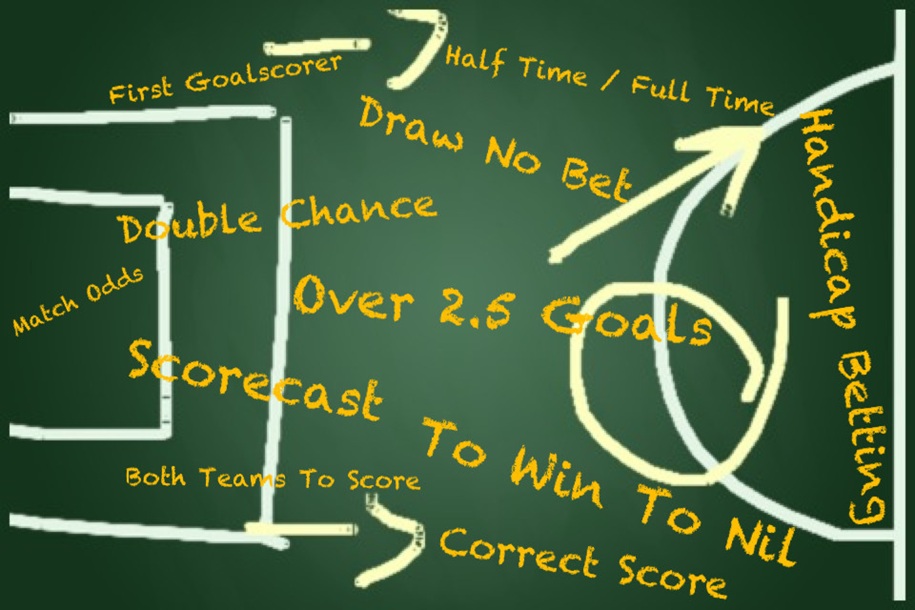
On 1X2, Asian Handicap and the main goals markets, a huge amount of information is already reflected in the odds. Team strength, injuries, recent results, home advantage and many other factors are constantly being analysed.
In the biggest leagues, however, you are not competing only against the bookmaker. Professional betting syndicates analyse enormous amounts of data on teams, players and markets, and their bets also influence the odds you eventually see. That is why it is extremely difficult to find an edge on the main markets if you are relying on the same public statistics everyone else has access to.
That does not mean bookmakers never make mistakes. It simply means the bar is much higher.
If your only reason for placing a Premier League bet is that a team has won four of its last five matches, you probably do not know anything the market has not already seen. On these markets, statistics are more useful as a starting point.
From there, you need to look for factors that are harder to measure – a tactical change, unusual fatigue, a new role for a specific player, or a situation where the raw numbers simply need more context. We look at this approach in more detail in our Premier League betting strategy.
Why Props Give You More Room
If you want to build a heavily data-driven strategy in the biggest leagues, props are often a better place to look for an edge than the main match markets.
Props let you test a more specific question. Instead of deciding whether a team will win, you might estimate a player’s shots, tackles, fouls or goalkeeper saves.
You can compare the player’s usual numbers with his role, expected minutes, opponent and the line being offered.
Props are not automatically easier or profitable, but they allow a much narrower hypothesis than a headline match outcome.
How to Use Sports Data for Betting in Lower Leagues
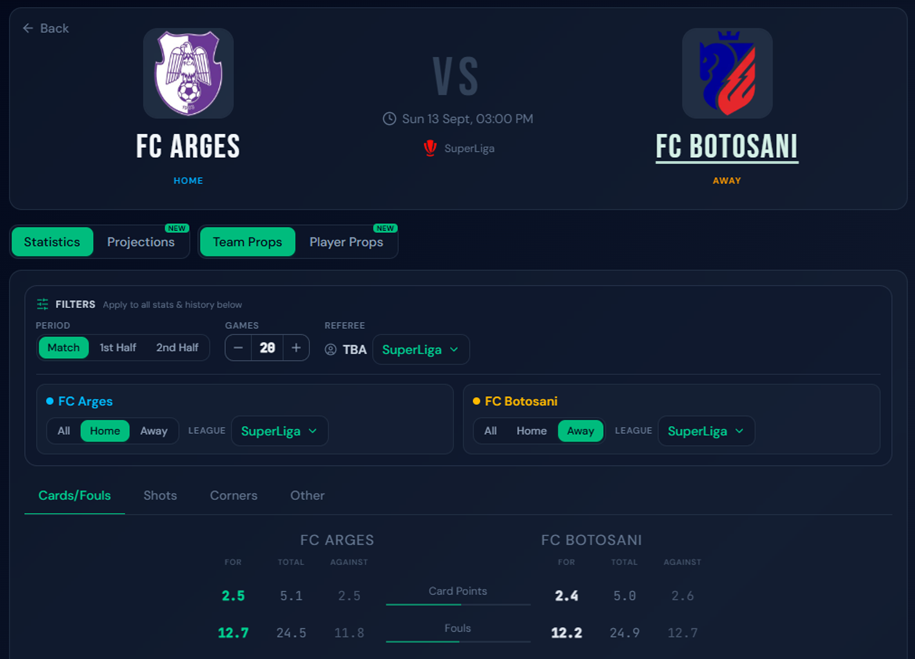
Lower-profile leagues create a different problem. There may be fewer props and thinner statistical coverage, leaving more focus on 1X2, handicaps and totals.
Having more sports data for betting does not automatically create more value. In lower leagues especially, the numbers become much more useful when you combine them with market comparison and current information.
Compare Local and International Bookmakers

Do not compare bookmakers only to find the highest price. Compare how they price the same league and how quickly those prices change.
A local bookmaker may react differently from a large international operator, while another may move first and the rest of the market may follow.
Useful fields to track include:
- opening odds at several bookmakers;
- the price when you bet;
- the direction and timing of major moves;
- the closing price.
Over enough matches, this can show which prices tend to contain useful information
Use Local News to Find What the Numbers Miss

In a lower league, team news may matter more than another season of old results if it is not distributed quickly across the market.
A late injury, unexpected rotation, travel problem or managerial change can alter the assumptions behind the existing price.
Historical performance gives you the baseline; current information tells you whether that baseline is still relevant.
How Much Historical Data Do You Actually Need?
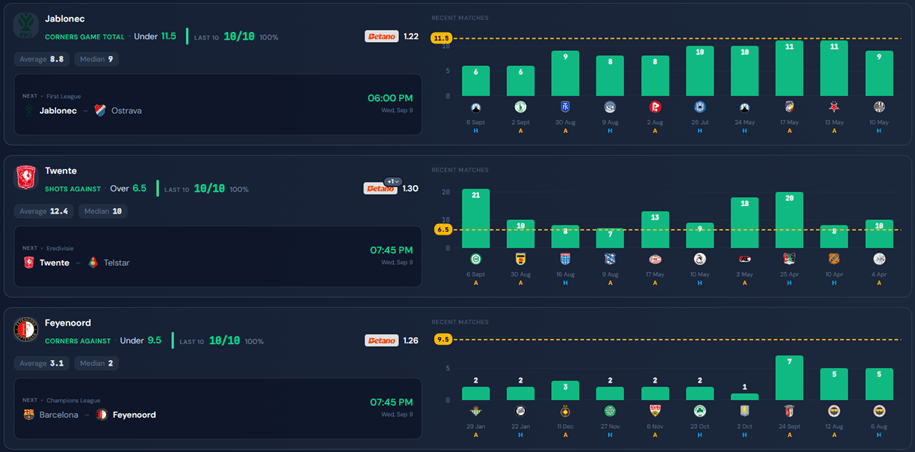
There is no magic amount of data for sports betting predictions that suddenly makes a strategy reliable. The right sample depends on how common the situation is, how volatile the market is and how narrowly you define the strategy.
A tiny sample is easily distorted by luck, while very old data can mislead if the league, rules or market have changed. Keep the sample relevant and separate development data from test data.
If a strategy works only after repeatedly changing the filters until the past looks profitable, you may simply be fitting the noise.
A Simple Process Before Betting Real Money
Before turning any pattern into a real strategy:
- Define exactly what you think the market is mispricing.
- Choose the league and market where the idea should apply.
- Collect results, prices and relevant team or player statistics.
- Test the idea without constantly changing the rules.
- Compare your entry prices with later market prices.
- Check whether the logic still makes sense today.
- Forward-test with small stakes or on paper before trusting the backtest.
Good sports betting data is useful here because the goal is not to collect every number available, but to find the statistics that can confirm or challenge your hypothesis.
Historical Data Is the Starting Point, Not the Strategy
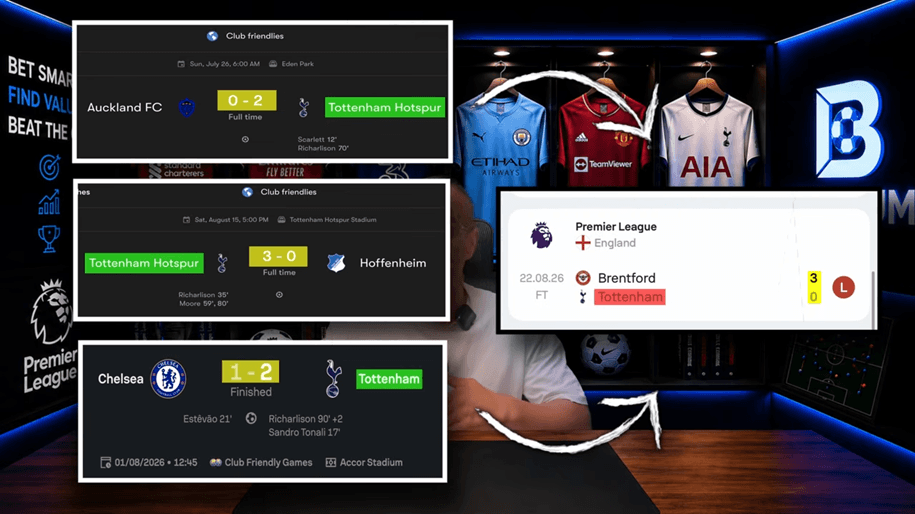
The biggest mistake you can make with sports betting data is to assume that the past contains a ready-made formula for the future.
Stats can help reject bad ideas, estimate probabilities and compare prices. But the final decision still depends on whether the market is offering the right price today.
In major leagues, that may mean looking beyond public team statistics or moving towards more specific props. In lower leagues, it may mean combining limited data with bookmaker comparison and information that has not yet been fully reflected in the odds.
The aim is not to discover the pattern with the prettiest historical return. It is to understand why an edge should exist, test whether it survived in the past and then ask the most important question:
Is the market still getting this price wrong now?
If we missed something, add it in the comments